· Strategy · 12 min read
Cost per Resolved Task: Pricing Agentic Workflows by Outcome Instead of Tokens
Cost per resolved task shows which agent steps earn their keep and which are cheaper left to people. A practical way to price agentic workflows by outcome.
In my work with teams shipping agents into support, operations and back-office flows, the first cost dashboard is almost always the same. It shows tokens in, tokens out, dollars per day, maybe a breakdown by model. It is accurate, and it is nearly useless for deciding anything.
The reason is simple. Nobody in the business buys tokens. They buy a refund processed, a ticket closed, an invoice matched, a contract clause flagged. Token spend tells you what the machine consumed. It says nothing about what the company got. Two workflows can burn the same number of tokens a month, and one can be a bargain while the other quietly loses money on every run.
I’ve seen a team celebrate a 30 percent drop in their token bill the same quarter their escalation rate went up. The agent was getting cheaper per call and worse per outcome. Because the dashboard measured the first and not the second, it took weeks for anyone to notice.
This article argues for a different unit: the cost of one resolved task. It is a small change in what you divide by, and it changes which steps you automate, which you hand back to people, and how you talk to the finance team.
- Token spend measures consumption. Cost per resolved task measures what the business actually bought, so it is the number that supports a build, keep or retire decision.
- The denominator matters more than the numerator: count only tasks that were resolved and stayed resolved, and load the cost of failures, retries, review and escalation onto them.
- Measured per step, the metric shows where an agent earns its place and where a person is cheaper, faster or safer.
- This is different from spend control. Budgets and routing cap what you spend; the outcome unit tells you whether the spend was worth it.
Spend control and outcome pricing answer different questions
There is good existing writing on the cost side of agents. The True Cost of Agentic Workflows covers how compute and API costs accumulate in autonomous loops, and Agent FinOps covers building budget constraints and routing logic into the agent loop itself. Both are about controlling how much you spend.
This piece asks a prior question: what are you spending it on? A perfectly governed budget can still be pointed at a workflow that should not be automated. Spend control keeps you from overspending. Outcome pricing tells you whether the thing you are underspending on was worth doing.
A simple way to hold the difference:
- Spend control asks, “Did we stay inside the envelope?”
- Outcome pricing asks, “What did each unit of business result cost us, all in?”
You need both. But if you only have the first, you will optimise the wrong thing with great discipline.
Defining a resolved task
The metric is only as honest as its definition, so this is where the work is. A resolved task has three properties.
It has a clear end state the business already recognises. A support ticket closed with the customer’s issue fixed. A purchase order matched and posted. A claim triaged to the right queue with the right fields. If you cannot name the end state without mentioning the agent, you do not yet have a task, you have an activity.
It stayed resolved. A ticket reopened within a window you choose (a few days is common for support) was not resolved, it was deferred. Without this rule, an agent that closes tickets quickly and wrongly looks like your best performer.
It was verified by something other than the agent. That might be a downstream system confirming the record, a human sampling a slice, a customer not coming back, or an automated check against a known rule. The agent’s own claim of success is not evidence.
Then the arithmetic:
cost per resolved task =
  (model + tool + infrastructure cost for ALL attempts
   + human review and escalation time
   + cost of rework and corrections)
  / number of tasks that were resolved and stayed resolved
Notice what goes in the numerator. Every attempt counts, including the ones that failed, looped, or were abandoned. Every minute a person spent reviewing or fixing counts. Only the denominator is filtered. This is what makes the metric honest: failures are not free, they are paid for by the successes.
A hypothetical worked example
The numbers below are invented to show the mechanics. They are not benchmarks and do not describe any real system or provider.
Suppose an agent handles a class of billing queries. In a month it attempts 10,000 tasks.
- Model and tool calls across all attempts: $2,000 (hypothetical)
- Infrastructure and observability share: $500
- Of the 10,000 attempts, 6,500 are resolved and stay resolved
- 2,500 are escalated to a person, who spends about 8 minutes each
- 1,000 are marked done by the agent but reopen later, needing 12 minutes of human rework each
- Loaded human cost: $30 an hour (hypothetical)
Human time on escalations: 2,500 x 8 minutes = 20,000 minutes, about 333 hours, about $10,000. Rework: 1,000 x 12 minutes = 12,000 minutes, 200 hours, $6,000.
Total cost: $2,000 + $500 + $10,000 + $6,000 = $18,500. Divide by 6,500 resolved tasks and you get roughly $2.85 per resolved task.
Now look at what the token view said: $2,500 over 10,000 attempts, or 25 cents an attempt. That looks wonderful. The honest figure is more than eleven times higher, and almost all of the difference is human time spent cleaning up after the agent.
That is not a verdict against the agent. If the fully human process costs, say, $4.00 per resolved task (also hypothetical), the agent still wins. But the margin is thin, and it is thin for a specific reason: escalation and rework. That points you at the lever. Cutting the model bill in half saves $1,000 a month. Cutting the rework rate in half saves $3,000. The token dashboard would have sent you to the wrong one.
Decompose it by step
The real power of the metric shows up when you stop treating the workflow as one thing. Most agentic workflows are a chain of steps with very different economics.
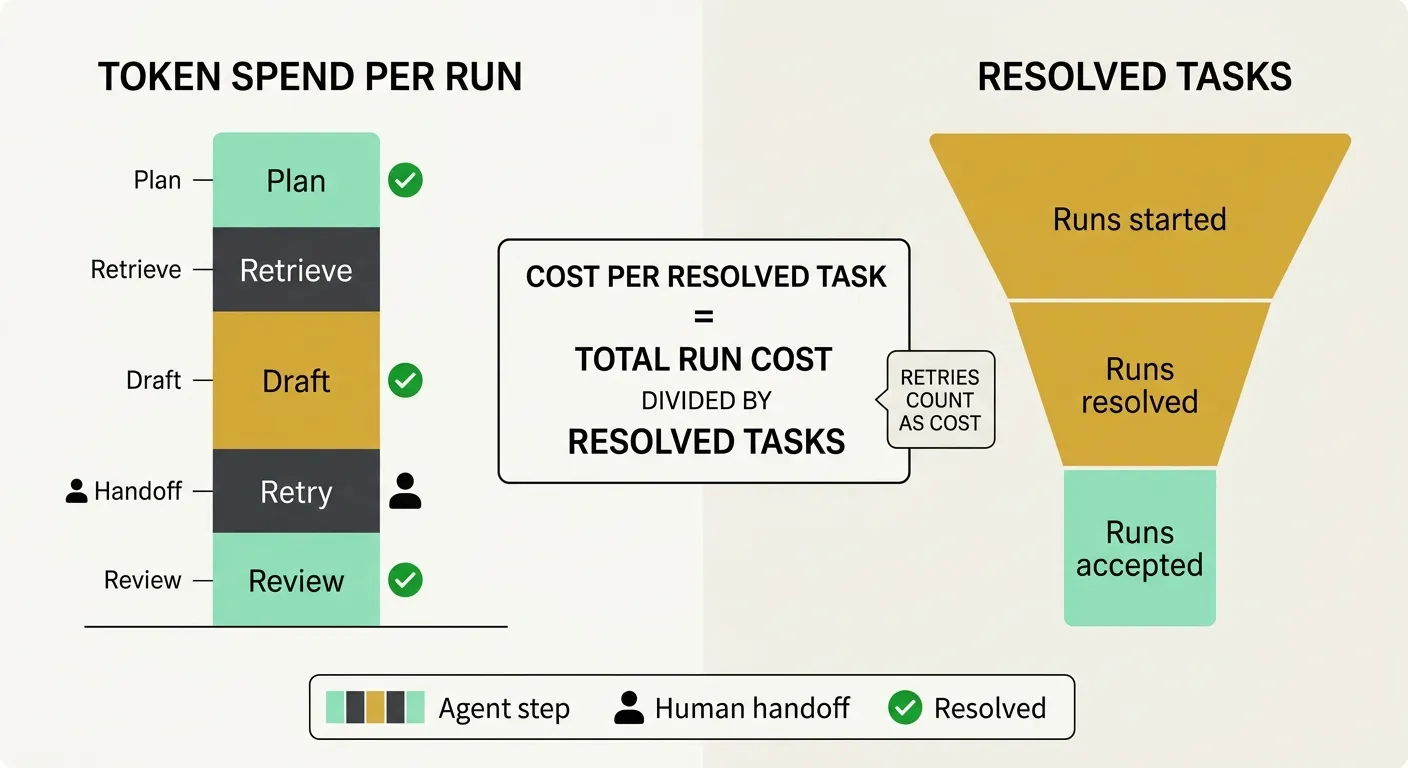
For each box you can ask three questions: what does it cost when it works, how often does it work, and what does it cost when it fails. Then compare against a person doing the same step.
In practice the pattern is consistent enough to describe:
Classification and context gathering are often cheap and reliable. Reading a message, pulling the account record, summarising history. Failures here are cheap to catch and cheap to repair. These steps tend to have the lowest cost per successful step and are usually worth automating.
Decision steps vary widely. Where the rule is clear and the stakes are small, an agent is fine. Where the decision depends on judgement, unwritten policy or a customer who is upset, the failure cost climbs. A wrong refund approval costs more than the tokens that produced it.
Execution steps carry the asymmetric risk. Writing to a system of record, sending a message to a customer, moving money. A failure here is not just a retry, it may be a correction, an apology, or an audit finding. The cost per resolved task should carry that tail explicitly.
Verification is where teams skimp, and then pay. If verification is another model call grading the first, you have measured agreement, not correctness. An independent check is worth real money because it is what keeps your denominator honest.
When you compute cost per resolved task for each segment, you will usually find that some steps are well below the human cost and some are above it. The mistake is to automate or not automate the whole workflow on the average.
Which steps are cheaper left to people
This is the part that makes some stakeholders uncomfortable, so it is worth being plain. A step belongs with a person when one of these holds:
- Failure cost dominates. If a wrong action costs a hundred times the cost of doing it by hand, even a high success rate may not pay. The expected cost of failure, not the average cost of success, decides it.
- The step is rare and varied. Automation amortises over volume. A step that happens a few dozen times a month with a different shape each time rarely repays the evaluation, monitoring and maintenance it needs.
- Verification is as expensive as the work. If you must have a person check every output anyway, you have added a step, not removed one.
- The human does something the metric does not see. A support rep who calms a customer is producing retention, not just a closed ticket. If that value is real, price it in rather than pretending the step is mechanical.
None of this is an argument against automation. It is an argument for doing it where it pays and being able to show where. Often the best design is a hybrid: the agent does intake, context and a draft, and a person approves the action. Cost per resolved task will tell you whether that hybrid beats both extremes, which it often does.
What this does to the choice of model and hosting
Outcome pricing also gives you a neutral way to compare technical options without ideology. Whether a step runs on a hosted frontier model, an open-weights model you serve yourself, or a smaller model on your own infrastructure, the question is the same: what is the all-in cost per resolved task for this step, at the volume and quality bar you actually have?
A larger model can look expensive per token and still be cheaper per resolved task if it fails less and escalates less. A small model can look cheap per token and be costly per outcome if its errors land on a person’s desk. Self-run options bring control over data location and unit cost at steady volume, but also operational load that belongs in the numerator. Hosted options bring capability and support, but with usage-based pricing that scales with every retry. Which one wins depends on your volume, your risk tolerance, your team’s ability to run evaluations, and your compliance context. The metric does not pick for you. It makes the comparison fair.
How to start without a data project
You do not need a platform to begin. A workable first pass looks like this.
- Pick one workflow and name the end state. Write it as a sentence a business owner would sign.
- Log every attempt with an outcome tag. Resolved, escalated, abandoned, reopened. Even a spreadsheet export works at first.
- Add human time honestly. Sample it if you cannot instrument it. An estimate labelled as an estimate beats leaving it out.
- Set a reopen window and apply it. Revisit the number after the window closes, not on the day.
- Compute it per step, then in total. Compare each against the human baseline for the same step.
- Review monthly with finance in the room. The point is a shared number, not an engineering artefact.
A caution on the baseline. The human cost per resolved task is also a number you have to measure, and it is usually less tidy than people assume. Handle times vary, quality varies, and people also have failures and rework. Compare like with like, and include the same kinds of loaded costs on both sides.
The executive view
For a leader, the shift is from “how much is AI costing us?” to “what are we paying per result, and where is it improving?” That reframes several conversations.
Budgeting becomes a function of volume of outcomes, not an opaque usage line that grows unpredictably. Vendor negotiations get sharper, because you can ask what a price means per resolved task rather than per million tokens. Roadmap decisions get easier, because you can rank candidate automations by the gap between human and agent cost per resolved task, weighted by volume and by failure risk. And when something goes wrong, you can see whether it is a model problem, a verification problem or a process problem.
It also guards against a quiet failure mode: savings that are really cost transfers. If the agent’s cheap output is creating work for a team that sits in a different budget line, the token dashboard will report success while the company pays more. Cost per resolved task, loaded with human time wherever it lands, makes the transfer visible.
Limits of the metric
It is worth being honest about what this does not do. Defining “resolved” takes judgement, and different teams will draw the line differently, so compare within a workflow before comparing across them. Some outcomes are slow to confirm, which delays the number. Quality differences inside a resolved task (a fast, curt answer versus a thorough one) are invisible unless you add a quality measure alongside. And the metric can be gamed, as any metric can: if you reward a low number, the cheapest path may be to mark things escalated or abandoned. Pair it with a satisfaction or accuracy check so it cannot be improved by quietly doing less.
Used with those limits in mind, it remains the most useful single number I know for this problem, because it forces the conversation back to what the business wanted in the first place.
Where to go next
Start with one workflow, one definition of resolved, and one month of honest logging. Do not be surprised if the result embarrasses the dashboard you already have. The goal is not a lower number for its own sake. It is knowing, step by step, where an agent earns its place and where a person is the better buy, and being able to say so with evidence.